Creating a responsive bar chart for my tags
Posted on Fri 21 July 2017 • 5 min read
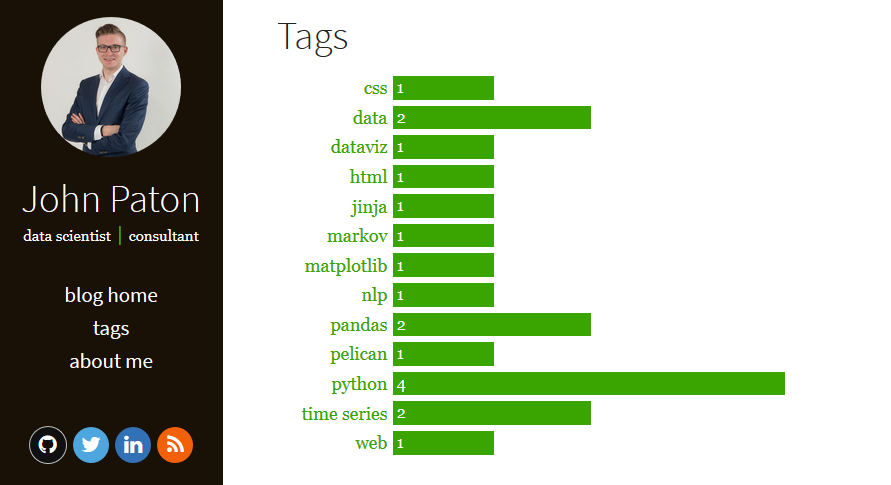
Today I decided that, since I’m a data kind of guy, I would like my tags page to show a bar chart of how many posts per tag I’ve made. The idea was to basically have a list of tags on the left, with a bar chart on the right showing how many articles are tagged with that tag. Obviously the bars should scale to the size of the window. If you were too lazy to click the link, the result I came up with (at the time of writing) looks like this:
It turned out to be more complicated than I was expecting since I had to work around the constraints of a static site. My solution basically consists of 3 parts:
-
An extra setting in my Pelican configuration so I can turn the graph back off if I get bored of it
-
CSS to render a responsive bar chart
-
Modification of the jinja2 template for my tags page
Setting the Pelican configuration
I literally just added the variable TAG_GRAPH = True to my configuration file, which is basically a file with a bunch of Python variables that tells Pelican what to do. This is going great!
I also needed to add one more line making an extension available to jinja:
JINJA_ENVIRONMENT = {'extensions': ['jinja2.ext.do']}
We’ll get to what it’s used for further on.
Setting up the CSS
This is only the second time I’ve tried to actually accomplish something in CSS, so it was a bit of a struggle. Codepen.io and Chrome’s Inspect tool both turned out to be very handy (thanks for the tip, Davide). I did a bunch of tweaking to get everything looking how I wanted it to, but I’ll just include the basics here to get something up and running. If you’re implementing it yourself you can look at this site’s stylesheet for all the dirty details.
What I ended up doing was making a table with one column to contain the tag name and a second column for the bars. I set up a few different element classes:
table#tagsto set the size of everythingtd.tagfor the tag namestd.tagbarcolto contain the barsdiv.tagbarto act as the bars
We give the whole table a bit of a margin to keep it away from the page title, and make it take up 90% of the available width:
table#tags{
    margin-top:1em;
    width:90%;
}
The tag column needs the text to be right-justified, and it also gets a minimum width so that the tag names aren’t too cramped. Keep this small enough that there is enough room for the bars, even on a phone screen.
td.tag{
  text-align:right;
  min-width:6em;
}
We give the column for the bars a width of 100% so that it will take up all the horizontal space not used by the tag names:
td.tagbarcol{
  width:100%;
}
Finally we give the div‘s background the color we want to use for the bars, set the text to white for our data labels, and give it a bit of padding so that the labels aren’t too cramped:
div.tagbar{
  background-color:#3aa500;
  color:#fff;
  padding:0.1em
}
The structure of the table is as follows:
<table id='tags'>
    <tr>
        <td class="tag">
            tag1
        </td>
        <td class="tagbarcol">
            <div class="tagbar" style="width:100%">
                5 <!-- data label -->
            </div>
        </td>
    </tr>
    <tr>
        <td class="tag">
            tag2
        </td>
        <td class="tagbarcol">
            <div class="tagbar" style="width:40%">
                2
            </div>
        </td>
    </tr>
</table>
The trick is that we set the width of the tagbar div individually for each bar, making the largest value 100% and everything else a fraction of that. That way the longest bar will take up all of tagbarcol, reaching out to the edge of your table, and smaller columns are proportionally shorter. The width of tagbar is relative to tagbarcol, tagbarcol is relative to the table, and the table is relative to the screen (or whatever container it’s in), so that as long as the outermost container is responsive, the bars will scale nicely.
The above bare-bones example yields the following responsive bar chart:
You can play with this setup yourself in this codepen I made.
Making the jinja template
This site is powered by Pelican, which uses jinja to make a set of HTML templates that are filled with content I write whenever I regenerate the site. The template I care about in this case is the one that generates my tags page. The theme I’m using is a fork of Flex that I’m slowly hacking into something that suits my own whimsical desires.
To generate the table structure above, we need to know what the largest data value will be so that we can make everything else relative to that. Pelican provides a variable called tags to jinja that as best I can tell is a dictionary in the form of {tag: [list of articles]}. The existing Flex template looped through this, using the values of tag and the length (in jinja: |count) of the articles list to get the number of articles for each tag. Unfortunately jinja doesn’t seem to have a maximum function, so I realized I would have to loop through the tags and find the largest count myself. However, jinja also doesn’t seem to let you assign variables dynamically within a loop; you can only call methods on them. In the end I settled on the following ghetto solution:
{% set max_articles = [0] %}
{% for tag, articles in tags %}
  {% if articles|count > max_articles|last %}
    {% do max_articles.append(articles|count) %}
  {% endif %}
{% endfor %}
What I’m doing is looping through the articles and appending to a list (which you can do in a jinja loop) every time I see a value larger than the one at the end of the list. The |last filter accesses the last value in the list (obviously), so once this loop is done running, max_articles|last is the value I want all my bars to be relative to. It’s ugly, but it works (a very common theme in my life).
In order to use the do statement, we need to make the do extension available to jinja (don’t worry, it comes included by default). Gaining access to this functionality was why I included jinja2.ext.do in my jinja environment in my Pelican configuration.
Now that we know what value to use for our percentages, we can construct the table. I added an if statement to my template file so that I can still return to my old theme’s design just by changing the TAG_GRAPH variable in my Pelican configuration file.
I ended up with the following in my template:
{% if TAG_GRAPH %}
  <table id="tags">
    {% for tag, articles in tags|sort %}
      <tr>
        <td class="tag">
          <a href="{{ SITEURL }}/{{ tag.url }}">{{ tag }}</a>
        </td>
        <td class="tagbarcol">
          <div class="tagbar" style="width:{{ 100 * articles|count / max_articles|last }}%">
            {{ articles|count }}
          </div>
        </td>
      </tr>
    {% endfor %}
  </table>
{% else %}
  <!-- The old theme -->
{% endif%}
The single table is set up, and then jinja loops through the tags. For each tag, it makes one row. It puts each tag name (and a link to that tag’s articles) in the tag column. It sets up the tagbarcol column and puts a tagbar inside it, with width 100 * <number of articles for that tag> / <maximum number of articles>, where the maximum number of articles comes from the hacky loop above.
And that’s it! If you didn’t click the link before but are now feeling inspired, check out the tags page! It was a bit complex but I’m happy with the result.
Did I do something stupid? Would you have done something differently? Let me know!